
From lifecycle to business impact
The establishment of a standardized technology product information data basis with current lifecycle information sets the basis for smart technology risk management. But it doesn’t end here. Let’s look again at our opening example of the CIO who is surprised by an ad-hoc need to upgrade to a new database technology. The short conversation reveals three challenges of managing technology risk.
If outdated technology is not managed proactively, the need for change takes management by surprise. Secondly, the basis for informed decisions is regularly not available. Finally, the impact and rippling effects of outdated technology are not obvious. Many executives struggle to connect the abstract risk of obsolete technology to real business impact. The setup of a technology risk management process should not be blown out of proportion. With the right tools in place, it will be set up in a matter of days and soon become common practice in your IT management
1. Complete your information basis
With consistent standard technology products and up-to-date lifecycles from Technopedia in LeanIX, the basis is set to manage the risk of technology obsolescence. This information is already enough to get started. You might, however, see value in adding additional inputs to estimate the risk of end-of-life technology. LeanIX provides the platform to combine all information in one place, be it quantitative or qualitative.
Quantitative Information
Successful technology risk management is data-driven. Considering additional data for Technology Risk management allows for objective decisions. Typically, there is plenty of operational data available that provide useful indicators of the riskiness of applications’ underlying technology. The challenge usually is, to make the data available in the context of the whole IT landscape, e.g. link it to a specific application. With the LeanIX Metrics Add-On, you can easily realize this: Visualize application availability data from Pingdom, show response times from New Relic and Incidents from Pagerduty. Or feed any other time-series data from any source that is useful to assess the risk of a certain technology.
Automatically generated graphs provide a visual representation of the risk factors: Did the application have more and more outages over the last year? Are response times bad, compared to other applications? Is the system prone to incidents? This information can be leveraged to underline your assumption that the end of life technology really causes problems.
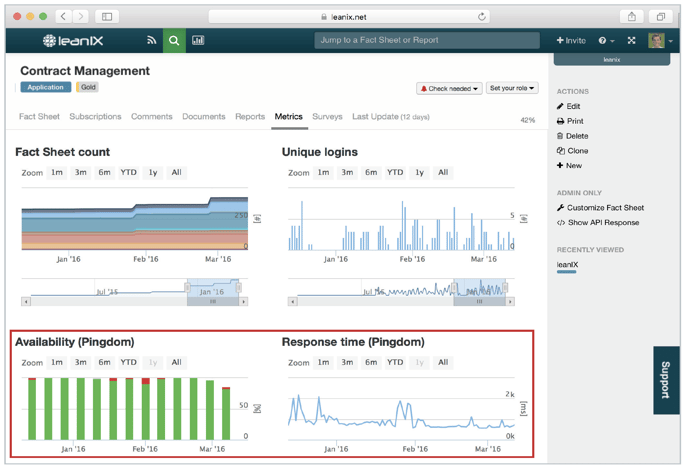
Figure 1: LeanIX Metrics showing time-series data on availability and response time for one application.
Qualitative Information
While the foundation of your technology risk management should be based on “hard” data, it is common practice and useful to complete the picture with expert opinions. LeanIX provides easy-to-use mechanisms to capture these additional inputs. Experts can rate the technical fit of applications on a four-star scale based on easy-to-understand definitions. Does the application need technical upgrades to ensure ongoing support of business requirements? Is it adequate, with just some parts to be improved? Experts are usually good at providing a quick and accurate estimate based on simple scales. Also, this process should be kept simple. Assign responsibilities per Application Fact Sheet that are capable of assessing the technical risk. The risk can be assessed in a decentralized way, without the need of time-consuming workshops or interviews. The LeanIX quality workflow ensures that the risk assessment is always up to date. For many companies, such a pragmatic assessment is already enough. However, for public companies usually, external demands regarding technology risk management apply. They might need to collect data regarding confidentiality requirements, password policies and more. LeanIX also supports these additional requirements of larger companies with smart data gathering workflows with the LeanIX Survey Add-On.
2. Analyze potential impacts
The simple risk formula states: risk = probability x impact. In the described approach, the main input used for the probability is the lifecycle information provided by the vendor. We showed ways to further enrich this information with quantitative and qualitative data. So the last step is to understand the impacts of technology obsolescence risk.
A risk cartography can be used to show relations between IT components (technology layer) via applications (information layer) to business capabilities (business layer). These pictures help to illustrate complex dependencies and ensure that the risk problem is tackled from a holistic perspective. Looking at the risk cartography, risks can be identified at the infrastructure level and can be traced up to the severity of implications for the business.
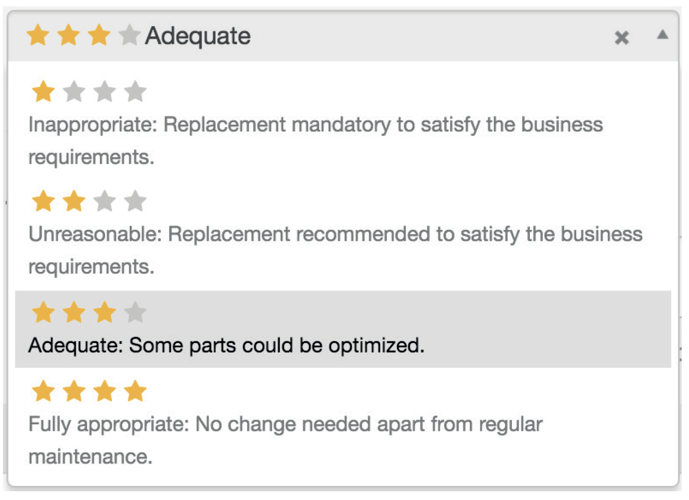
Figure 2: LeanIX Application Fact Sheet, assessment of technical fit.
The severity of the risk can be assessed by many different parameters: How many users are affected by a potential outage? What revenue impact does an application outage have? What are regulatory or compliance impacts? Does the technology risk result in an inability to meet needs for further business growth? A good way to further analyze ripple effects in the landscape is to understand how applications are connected. An application that is deeply embedded into the landscape via multiple interfaces can cause severe implications in case of an incident. Imagine a CRM system that is central for customer records and has integrations to Microsoft Exchange, mailing tools, helpdesk tools, content management systems, and much more. Due to the high interconnectedness, potential implications on other applications and processes multiply.
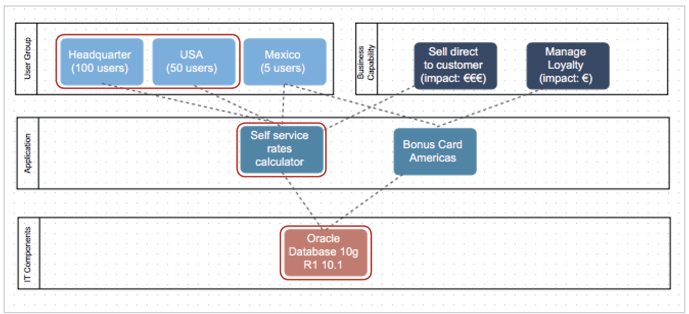
Figure 3: LeanIX Visualizer showing a risk dependency map.
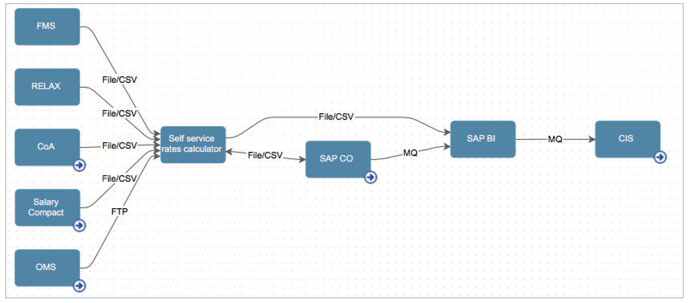
Figure 4: LeanIX Visualizer data flow showing the integration landscape.
3. Send a simple message
While the risk of obsolete technology probably is intuitively clear to you, it might not be to business leaders. The inputs of your assessment could be many, but in the end, the message for leaders needs to be easy to grasp. What should I do? What happens if I don’t do it?
Business capabilities have proven to be a good translation layer between the technical and non-technical world. Business capabilities encapsulate what a business is doing right now and what it needs to be doing in order to meet current and future challenges. They make life easier, as they are fairly stable over time, are much more tangible than strategy, and have the potential to overcome organizational silos. Therefore, they provide the right context to present technology risk.
Have a look at the representation below. It encapsulates the impact of technology risk from lifecycle to business value in a single report. The colored boxes represent different applications. Applications are supported by the underlying technology. Based on the lifecycle information fed in from Technopedia, the applications can have three statuses:
They can either be green, meaning all IT Components related to it are supported by the vendor. They can be yellow, meaning at least one IT Component is being phased out. Or they can be red, meaning that one or several IT Components are not supported anymore. But the report tells much more than the applications affected by technology obsolescence. It links them to Business Capabilities. The report below shows the three Business Capabilities that are marked as being part of the Strategy 2020 program. Especially the Customer Management Capability of the example seems to be affected by risk through outdated technology. Now let’s combine this static report with a time axis. If we fast forward and show the development over time, it is a powerful way to send the following message to management: if you don’t act today we will be in even bigger trouble later, so let’s do something today.
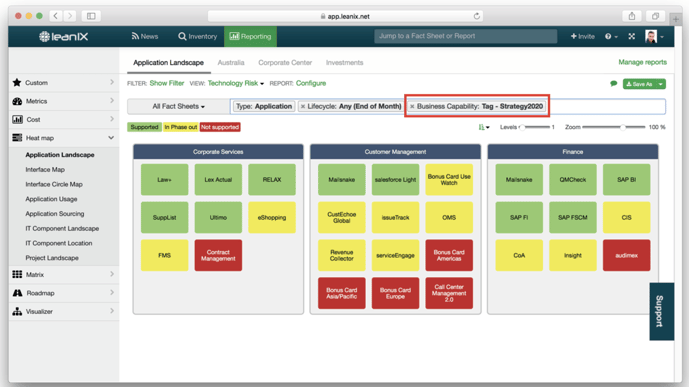
Figure 5: LeanIX Application Landscape showing technology obsolescence for Business Capabilities marked with ‘Strategy 2020.’
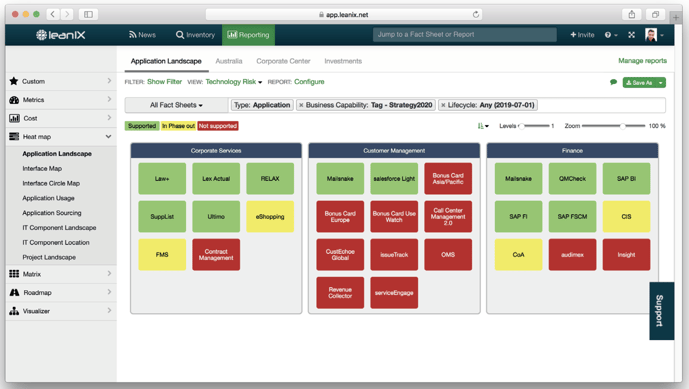
Figure 6: LeanIX Application Landscape that shows technology obsolescence risk in the future.
Summary
Most companies are much better at introducing new technologies than retiring them. The cost of running unsupported technology can be high. Costs of IT outages and data breaches run into the millions. At the end-of-life of technology, IT management has to deal with challenges such as integration issues, limited functionality, low service levels, lack of available skills and missing support from vendors. The twenty largest technology vendors alone provide over a million different technology products. The related information, like lifecycles, can change every single day.
BDNA’s Technopedia provides a standard catalog with the latest technology product information. This information can be fed automatically into LeanIX and serve as the basis for proactive management of risk from technology obsolescence. LeanIX supports all steps of the technology risk process with features and out-of-the-box reports. Combined with the automated technology data input from Technopedia the formerly tedious technology risk management process becomes easy and fast. 
Be sure to read Part1, Part2, and Part3 of the Risk Management Series.


/EN-Tech-Stacks-Poster_Resource_Page_Thumbnail.png?width=140&height=99&name=EN-Tech-Stacks-Poster_Resource_Page_Thumbnail.png)