LeanIX Enterprise Architecture

Features to fast-track your EA success

Browserbar
Story Background

Interactive Tour

See how it works in action

85 %

Streamline IT reporting and save up to 85% of the time by building a comprehensive EA repository, boosting collaboration, and automating data synchronization

40 %

Accelerate decision-making and project starts by up to 40% through deep insights into the dependencies in the IT portfolio

25 %

Reduce up to 25% of technical debts in one year by gaining transparency in end-of-life technology

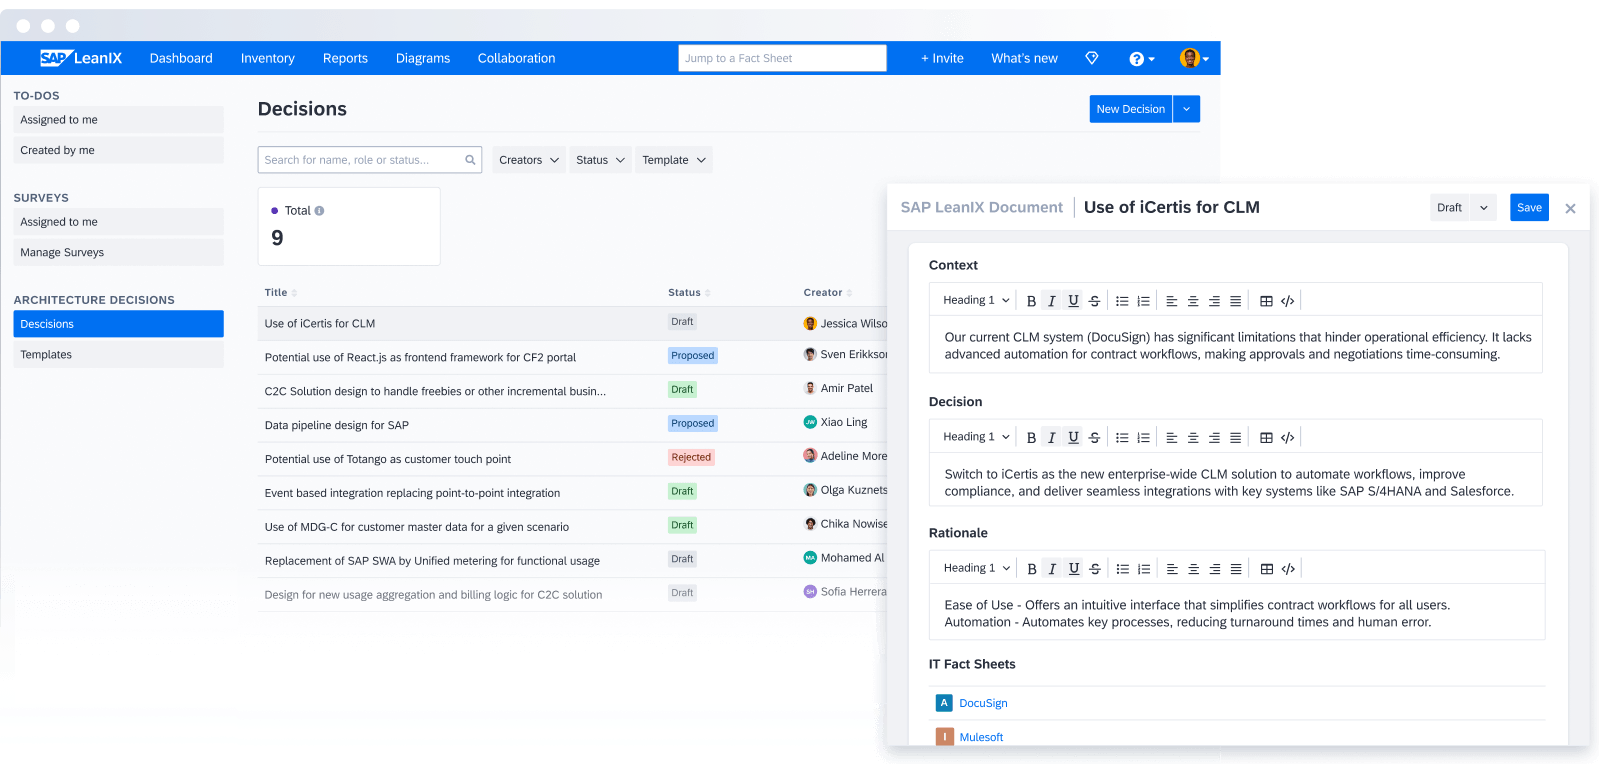
Continuous collaboration

Involve everyone within your organization to build a company-wide trusted data source and enable continuous transformation

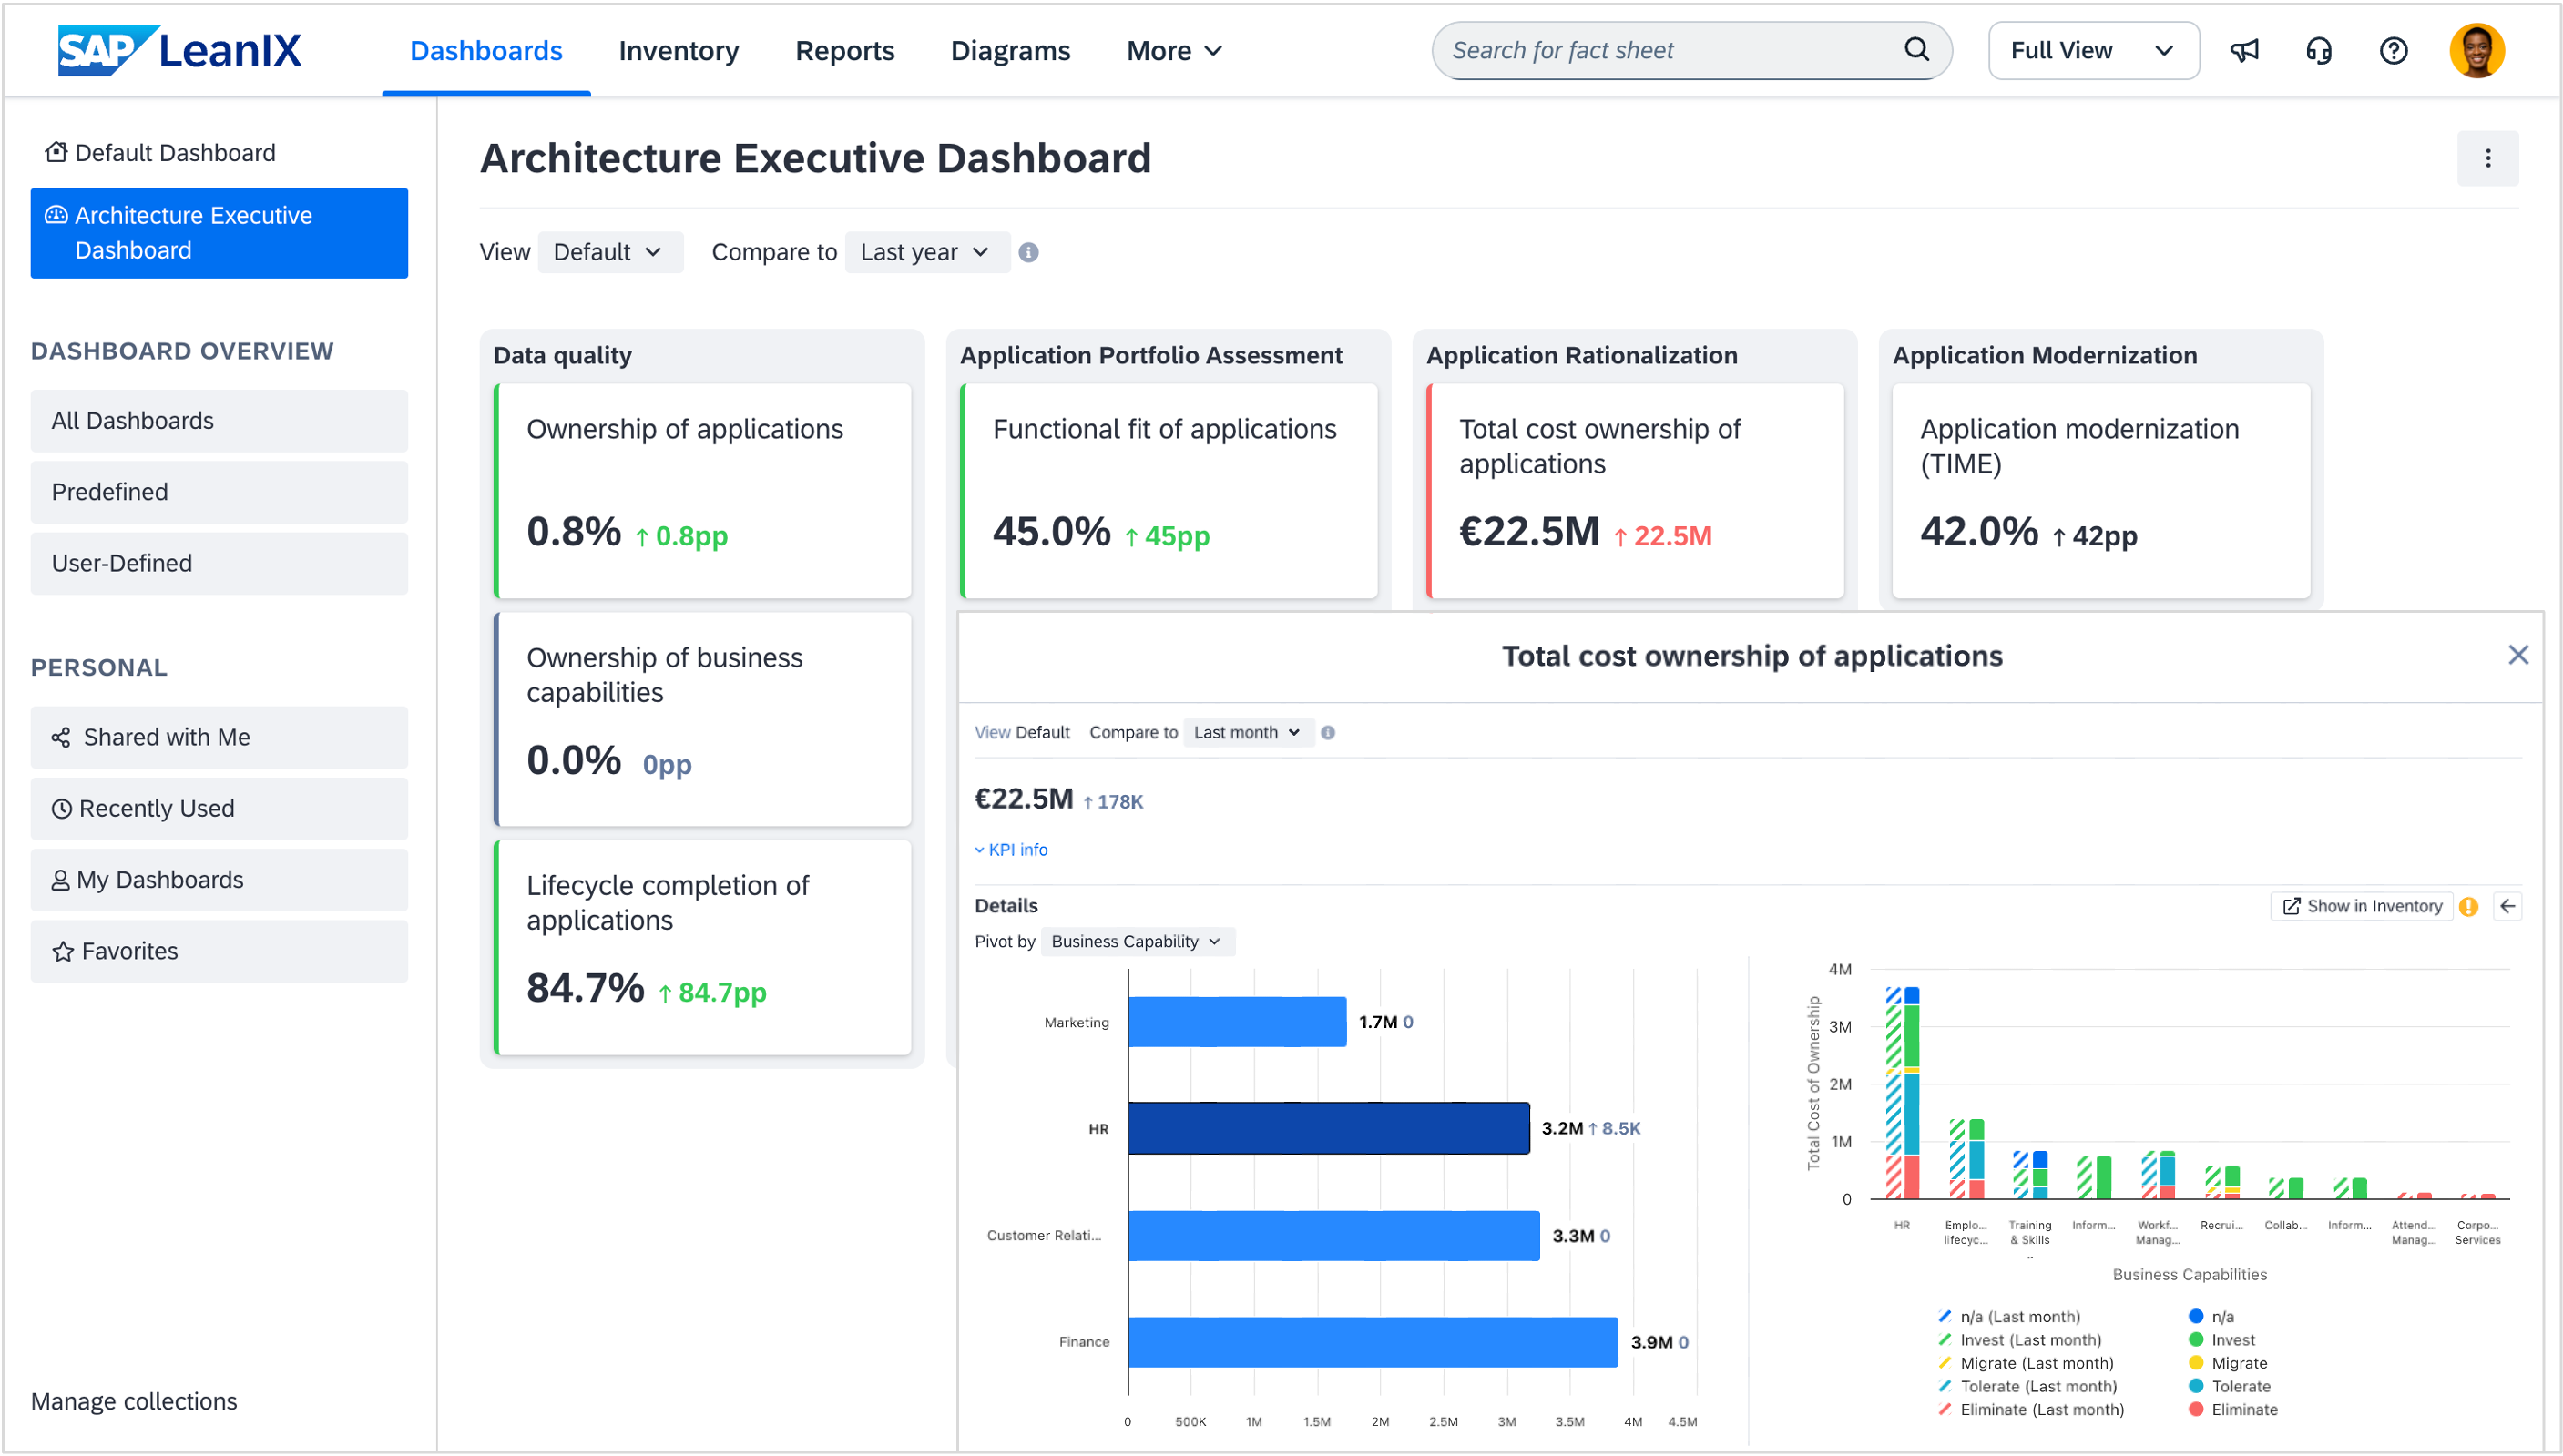
Customizable-Dashboard-V2
  • Customizable Dashboards & KPIs
    Visualize selected content, reports, and customizable KPIs on configurable Dashboards to keep your stakeholders updated
  • Surveys
    Leverage configurable Surveys to gather updates and insights from the right stakeholders and send them directly into your inventory
  • Tags
    Extend the Meta-Model with individual tags and leverage these individual aspects to improve searching, filtering, and reporting
  • AI Capabilities
    Use generative AI to query inventory data, generate descriptions in fact sheets, build lists of potential successors for applications, and add context to tasks for collaborators.
  • To-Dos and Comments
    Enhance the collaboration with your stakeholders and encourage them to take action with To-Dos or Comments
  • Quality Seals
    Check and improve your data quality by leveraging Quality Seals with configurable mandatory attributes
  • Notifications
    Configure notifications as emails, Microsoft Teams, and Slack messages for all users and stay on top of any changes in your EA repository
  • Automations
    Leverage no-code, rule-based, and easy-to-adopt Automations with triggers and action items to reduce time-consuming manual work
To-dos-V2

Reports and Diagrams

Gain real-time overviews of your IT landscape with state-of-the-art reports & diagrams

AppLandscape

Powerful and flexible visualization

Leverage a full set of unique and configurable reports to visualize the data in your IT repository and enable monitoring, tracking, and data-driven decision-making.
AppLandscape-2

Visualize current and future-states

Jump to any point in time of your business and IT landscape and analyze the impact of projects and scenarios on the as-is

App Matrix

Easily gain a comprehensive overview 

Make large reports consumable and reduce the time spent for scrolling 
Data Flow

Diagramming connected to Inventory data

Visualize dependencies in your IT landscape to make informed decisions about your as-is architecture and plan its transformation
Collections

Group Reports and Diagrams

Configure and visualize multiple collections of Reports and Diagrams for better navigation of use cases.
ESG-Capability-Map

Track and evaluate your ESG goals

Visualize a comprehensive overview of ESG initiatives and KPIs to help identify areas of improvement

Find out more »

Roadmap and Scenario Planning

Project future states and evaluate scenarios with
unique transformation planning capability

blue-check

Milestones

Create visual reference points to easily track major events and pending decisions on project roadmaps. If plans change, milestones give you the flexibility in changing the dates that get automatically updated in all parts of the project

blue-check

Impacts

Specify how a project will impact your IT landscape upon completion or achievement of set milestones

blue-check

Transformations

Define high-level changes to your IT landscape as groups of pre-defined or customized impacts

New-icon

Transformation Explorer

Centrally view and manage all your transformations and impacts on the IT landscape to better oversee your planned and ongoing projects
Roadmap and scenario Planning

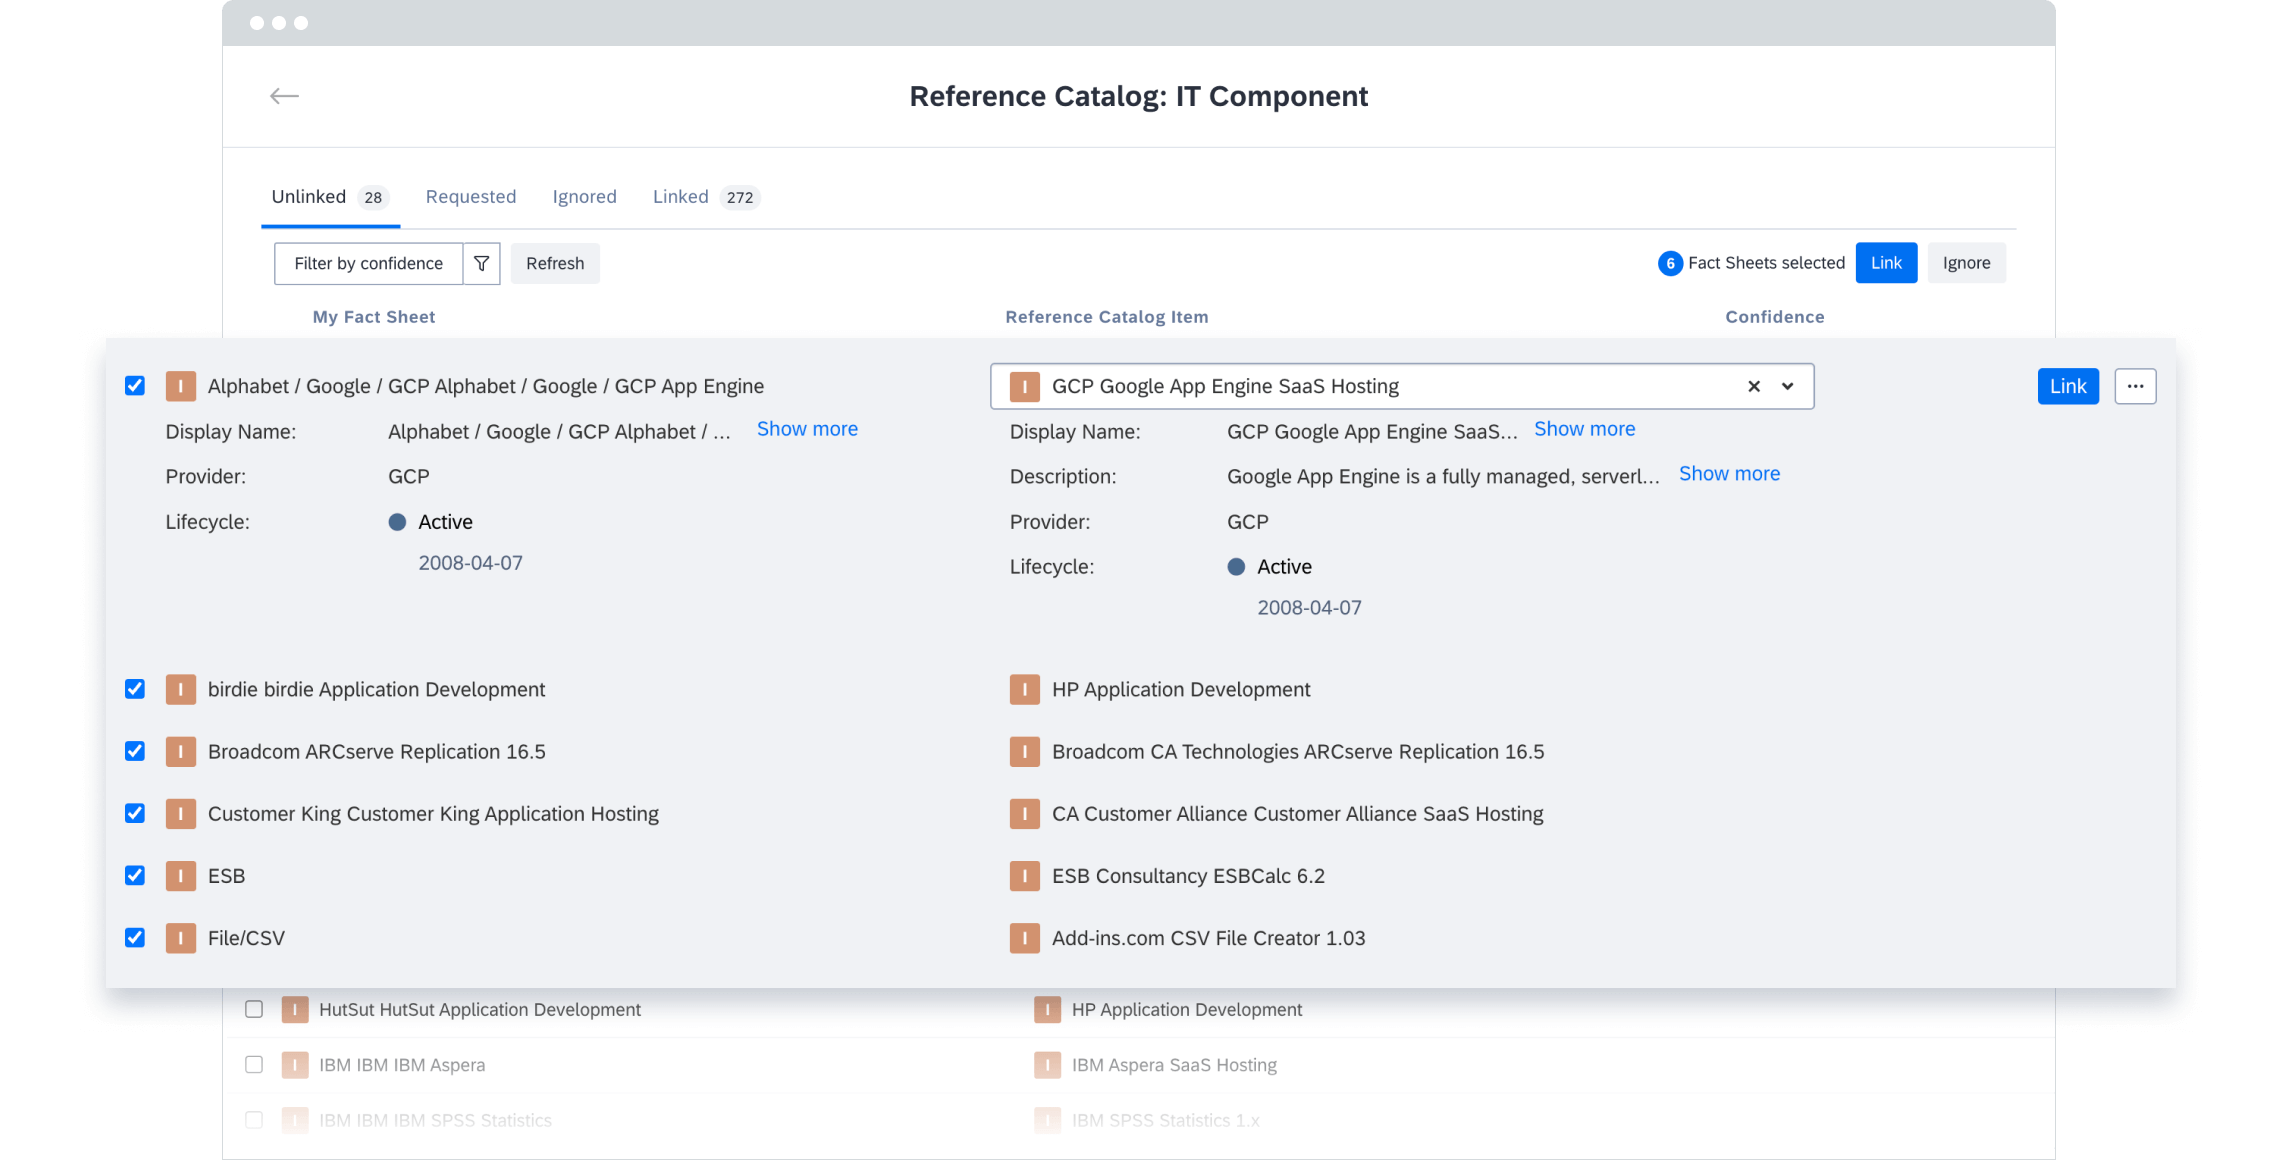
Reference catalog

Reduce manual effort and maintain a high-quality, consistent inventory with proprietary reference catalog maintained by SAP LeanIX

blue-check

IT components

Mitigate technology obsolescence risk in your IT landscape with up-to-date lifecycle information covering more than 62,000 hardware and software products

blue-check

Applications

Quickly supplement inventory data with a catalog featuring detailed information (name, logo, description, category, hosting) on over 13,000 applications

blue-check

Tech category

Easily adopt standard IT  taxonomies, such as Technology Business Management (TBM)

blue-check

Reference business architecture

Accelerate your business capability modeling and import industry-specific, best-practice business capability maps based on this comprehensive resource

Features-ReferenceCatalog

Integrations

Automate importing and exporting data through many out-of-the-box integrations and open APIs

  • Out-of-the-box Integrations
    Unleash architecture excellence and eliminate manual and time-consuming data collection with our integrations
  • Low-code Integration API
    Easily import and export data using a JSON-based format with an integrated development environment (IDE) that minimizes complexity as developers no longer have to understand the LeanIX Meta-Model
  • REST and GraphQL API
    Leverage REST and GraphQL APIs for high-performance queries
SAP-LeanIX-Integration-Features

Extendable

Adopt the LeanIX Meta Model and tailor it to your organization’s EA maturity and needs

Extendable
  • Meta Model Configuration
    Modify and extend the pre-defined, best-practice Meta-Model in self-service
  • LeanIX Store
    Access a broad variety of best-practice reports, surveys, and integrations to extend your LeanIX workspace and generate deeper insights

Accessible

Increase the accessibility of your inventory data

  • Portals
    Configure web-portals for quick and easy access to a defined scope of inventory data.
Application Portal